Data Variables’ Description
Compsrisons between converters/non-converters
- Numbers of converters and non-converters:
##
##   0   1
## 135  64
- Mean (sd) reported for each continous variable and n (%) for each categorical variable. t-tests used to compare converters and non-converters on continuous measures and Fisher’s exact test used for categorical measures.
|
|
|
|
(n = 199) |
(n = 135) |
(n = 64) |
|
|
| Age |
Age |
198 |
Age |
20.08 (3.82) |
20.11 (3.86) |
20.02 (3.76) |
-0.16 |
0.871 |
| P4a |
P4a |
184 |
auditory hallucations |
2.48 (1.59) |
2.54 (1.58) |
2.36 (1.61) |
-0.71 |
0.482 |
| P4v |
P4v |
184 |
visual hallucinations |
1.89 (1.49) |
2.12 (1.47) |
1.40 (1.41) |
-3.14 |
0.002 |
| P1 |
P1 |
199 |
unusual thought content |
3.58 (1.03) |
3.43 (1.01) |
3.91 (0.99) |
3.13 |
0.002 |
| P2 |
P2 |
199 |
paranoia |
3.34 (1.24) |
3.27 (1.22) |
3.48 (1.27) |
1.12 |
0.264 |
| P3 |
P3 |
199 |
grandiosity |
2.09 (1.59) |
2.04 (1.57) |
2.20 (1.64) |
0.69 |
0.493 |
| P4 |
P4 |
199 |
overall hallucinations |
2.85 (1.43) |
2.87 (1.40) |
2.83 (1.51) |
-0.18 |
0.860 |
| P5 |
P5 |
199 |
disorganization |
2.70 (1.31) |
2.50 (1.29) |
3.11 (1.27) |
3.1 |
0.002 |
| Ptot |
Ptot |
199 |
total positive symptoms sum of P1 P5 |
14.57 (4.00) |
14.11 (3.99) |
15.53 (3.87) |
2.37 |
0.019 |
| N1 |
N1 |
199 |
Social anhedonia |
3.54 (1.57) |
3.30 (1.54) |
4.03 (1.53) |
3.12 |
0.002 |
| N2 |
N2 |
199 |
avolition |
3.38 (1.63) |
3.28 (1.66) |
3.59 (1.56) |
1.26 |
0.208 |
| N3 |
N3 |
199 |
expression of emotion |
2.09 (1.72) |
1.87 (1.64) |
2.55 (1.83) |
2.61 |
0.010 |
| N4 |
N4 |
199 |
experience of emotions and self |
2.49 (1.89) |
2.40 (1.94) |
2.67 (1.77) |
0.95 |
0.343 |
| N5 |
N5 |
199 |
ideational richness |
1.85 (1.42) |
1.67 (1.30) |
2.25 (1.56) |
2.76 |
0.006 |
| N6 |
N6 |
199 |
occupational functioning |
3.79 (1.70) |
3.69 (1.73) |
4.00 (1.61) |
1.21 |
0.228 |
| N.Total |
N Total |
199 |
total negative symptoms sum of N1 N6 |
17.14 (6.65) |
16.21 (6.39) |
19.09 (6.82) |
2.91 |
0.004 |
| D1 |
D1 |
199 |
odd behavior |
2.57 (1.36) |
2.36 (1.34) |
3.02 (1.32) |
3.26 |
0.001 |
| D2 |
D2 |
199 |
bizarre thinking |
2.53 (1.46) |
2.44 (1.42) |
2.72 (1.55) |
1.27 |
0.205 |
| D3 |
D3 |
199 |
trouble with focus and attention |
3.17 (1.20) |
3.01 (1.16) |
3.48 (1.23) |
2.61 |
0.010 |
| D4 |
D4 |
199 |
impairments in hygiene |
1.62 (1.63) |
1.59 (1.65) |
1.69 (1.59) |
0.38 |
0.702 |
| D.Total |
D Total |
199 |
total disorganization symptoms sum of D1 D4 |
9.88 (3.82) |
9.40 (3.76) |
10.91 (3.77) |
2.64 |
0.009 |
| G1 |
G1 |
197 |
sleep disturbance |
2.69 (1.74) |
2.65 (1.75) |
2.77 (1.73) |
0.42 |
0.674 |
| G2 |
G2 |
199 |
dysphoric mood |
3.23 (1.55) |
3.40 (1.53) |
2.86 (1.55) |
-2.32 |
0.021 |
| G3 |
G3 |
199 |
motor disturbance |
1.92 (1.58) |
1.70 (1.47) |
2.39 (1.72) |
2.94 |
0.004 |
| G4 |
G4 |
199 |
impaired tolerance to stress |
3.91 (1.83) |
3.91 (1.84) |
3.91 (1.83) |
-0.02 |
0.986 |
| G.Total |
G Total |
197 |
total general symptoms sum of G1 G4 |
11.74 (4.25) |
11.65 (4.47) |
11.92 (3.77) |
0.42 |
0.672 |
| SIPS.Total |
SIPS Total |
199 |
sum of all total scores |
53.53 (13.75) |
51.67 (14.14) |
57.45 (12.07) |
2.82 |
0.005 |
| GAF |
GAF |
197 |
global assessment of functioning 0 100 |
45.18 (6.84) |
46.10 (7.08) |
43.18 (5.86) |
-2.84 |
0.005 |
| GFS..Social |
GFS |
158 |
Social social functioning |
5.35 (1.77) |
5.35 (1.76) |
5.37 (1.82) |
0.07 |
0.945 |
| GFS..Role |
GFS |
158 |
Role role functioning |
5.16 (2.35) |
5.12 (2.29) |
5.28 (2.49) |
0.39 |
0.697 |
| P1PD |
P1PD |
183 |
P1 subsymptom perplexity and delusional mood |
2.70 (1.12) |
2.64 (1.11) |
2.84 (1.15) |
1.12 |
0.266 |
| P1FR |
P1FR |
183 |
p1 subsymptom first rank symptoms |
1.73 (1.73) |
1.70 (1.72) |
1.81 (1.75) |
0.39 |
0.694 |
| P1OB |
P1OB |
183 |
P1 subsymptom overvalued beliefs |
2.14 (1.16) |
2.11 (1.08) |
2.19 (1.32) |
0.44 |
0.659 |
| P1SNG |
P1SNG |
183 |
p1 subsymptom somatic nihilistic and very guilty ideas |
1.96 (1.29) |
1.98 (1.27) |
1.93 (1.36) |
-0.22 |
0.823 |
| P1NP |
P1NP |
181 |
P1 non persecutory ideas of reference |
1.27 (1.35) |
1.29 (1.36) |
1.21 (1.35) |
-0.37 |
0.713 |
| Idea_Sev_Base |
Idea_Sev_Base |
193 |
Baseline Violent Ideation 0 is no 1 is yes |
56 (29.0) |
28 (21.5) |
28 (44.4) |
|
0.002 |
| Behav_Sev_Base |
Behav_Sev_Base |
193 |
Baseline Violent Behavior 0 is no 1 is yes |
12 ( 6.2) |
4 ( 3.1) |
8 (12.7) |
|
0.023 |
| SI_Base |
SI_Base |
193 |
baseline suicidal ideation 0 is no 1 is yes |
13 ( 6.7) |
7 ( 5.4) |
6 ( 9.5) |
|
0.442 |
| SB_Base |
SB_Base |
193 |
baseline suicidal behavior 0 is no 1 is yes |
5 ( 2.6) |
2 ( 1.5) |
3 ( 4.8) |
|
0.402 |
| Trauma_NonSexual |
Trauma_NonSexual |
193 |
any history of nonsexual trauma at baseline 0 is no 1 is yes |
29 (15.0) |
20 (15.4) |
9 (14.3) |
|
1.000 |
| Trauma_Sexual |
Trauma_Sexual |
193 |
any history of sexual trauma at baseline 0 is no 1 is yes |
21 (10.9) |
12 ( 9.2) |
9 (14.3) |
|
0.417 |
| Race (4 Category) |
race |
193 |
AA is 0, C is 1, As 2, mixed is 3 |
|
|
|
|
0.020 |
| Afr. Am. |
|
|
|
43 (22.3) |
26 (20.0) |
17 (27.0) |
|
|
| Cauc. |
|
|
|
87 (45.1) |
67 (51.5) |
20 (31.7) |
|
|
| Asian |
|
|
|
15 ( 7.8) |
6 ( 4.6) |
9 (14.3) |
|
|
| Other |
|
|
|
48 (24.9) |
31 (23.8) |
17 (27.0) |
|
|
| Race (Binary) |
race_bin |
193 |
c is 0 non c is 1 |
106 (54.9) |
63 (48.5) |
43 (68.3) |
|
0.015 |
| Schizotypal |
schizotypal |
193 |
scz is 1 non is 0 |
111 (57.5) |
70 (53.8) |
41 (65.1) |
|
0.185 |
| GRDS |
GRDS |
184 |
Genetic Risk and Deterioration syndrome no is 0 yes is 1 |
8 ( 4.3) |
5 ( 4.0) |
3 ( 5.0) |
|
1.000 |
| Family History |
famhx1 |
165 |
fam hx of psychosis 0 no 1 yes |
61 (37.0) |
41 (38.3) |
20 (34.5) |
|
0.750 |
| Female |
Female |
196 |
0 is no 1 is yes |
53 (27.0) |
41 (30.6) |
12 (19.4) |
|
0.140 |
- Below table shows similar info with Cohen’s d calculated for each continuous measure
- Note it’s computed as nonconverter - converter (take opposite for paper)
##             no_conv  conv     t  df    p n1  n2     d min max
## Age           20.11 20.02 -0.16 196 0.87 63 135 -0.02  13  29
## P4a            2.54  2.36 -0.71 182 0.48 58 126 -0.11   0   5
## P4v            2.12  1.40 -3.14 182 0.00 58 126 -0.50   0   4
## P1             3.43  3.91  3.13 197 0.00 64 135  0.47   0   5
## P2             3.27  3.48  1.12 197 0.26 64 135  0.17   0   5
## P3             2.04  2.20  0.69 197 0.49 64 135  0.10   0   5
## P4             2.87  2.83 -0.18 197 0.86 64 135 -0.03   0   5
## P5             2.50  3.11  3.10 197 0.00 64 135  0.47   0   5
## Ptot          14.11 15.53  2.37 197 0.02 64 135  0.36   4  22
## N1             3.30  4.03  3.12 197 0.00 64 135  0.47   0   6
## N2             3.28  3.59  1.26 197 0.21 64 135  0.19   0   6
## N3             1.87  2.55  2.61 197 0.01 64 135  0.40   0   6
## N4             2.40  2.67  0.95 197 0.34 64 135  0.14   0   6
## N5             1.67  2.25  2.76 197 0.01 64 135  0.42   0   5
## N6             3.69  4.00  1.21 197 0.23 64 135  0.18   0   6
## N.Total       16.21 19.09  2.91 197 0.00 64 135  0.44   0  31
## D1             2.36  3.02  3.26 197 0.00 64 135  0.50   0   5
## D2             2.44  2.72  1.27 197 0.21 64 135  0.19   0   5
## D3             3.01  3.48  2.61 197 0.01 64 135  0.40   0   6
## D4             1.59  1.69  0.38 197 0.70 64 135  0.06   0   6
## D.Total        9.40 10.91  2.64 197 0.01 64 135  0.40   1  18
## G1             2.65  2.77  0.42 195 0.67 64 133  0.06   0   6
## G2             3.40  2.86 -2.32 197 0.02 64 135 -0.35   0   6
## G3             1.70  2.39  2.94 197 0.00 64 135  0.45   0   6
## G4             3.91  3.91 -0.02 197 0.99 64 135  0.00   0   6
## G.Total       11.65 11.92  0.42 195 0.67 64 133  0.06   0  20
## SIPS.Total    51.67 57.45  2.82 197 0.01 64 135  0.43  16  82
## GAF           46.10 43.18 -2.84 195 0.01 62 135 -0.44  31  60
## GFS..Social    5.35  5.37  0.07 156 0.95 46 112  0.01   1  10
## GFS..Role      5.12  5.28  0.39 156 0.70 47 111  0.07   1  10
## P1PD           2.64  2.84  1.12 181 0.27 57 126  0.18   0   5
## P1FR           1.70  1.81  0.39 181 0.69 57 126  0.06   0   5
## P1OB           2.11  2.19  0.44 181 0.66 57 126  0.07   0   4
## P1SNG          1.98  1.93 -0.22 181 0.82 57 126 -0.04   0   5
## P1NP           1.29  1.21 -0.37 179 0.71 57 124 -0.06   0   5
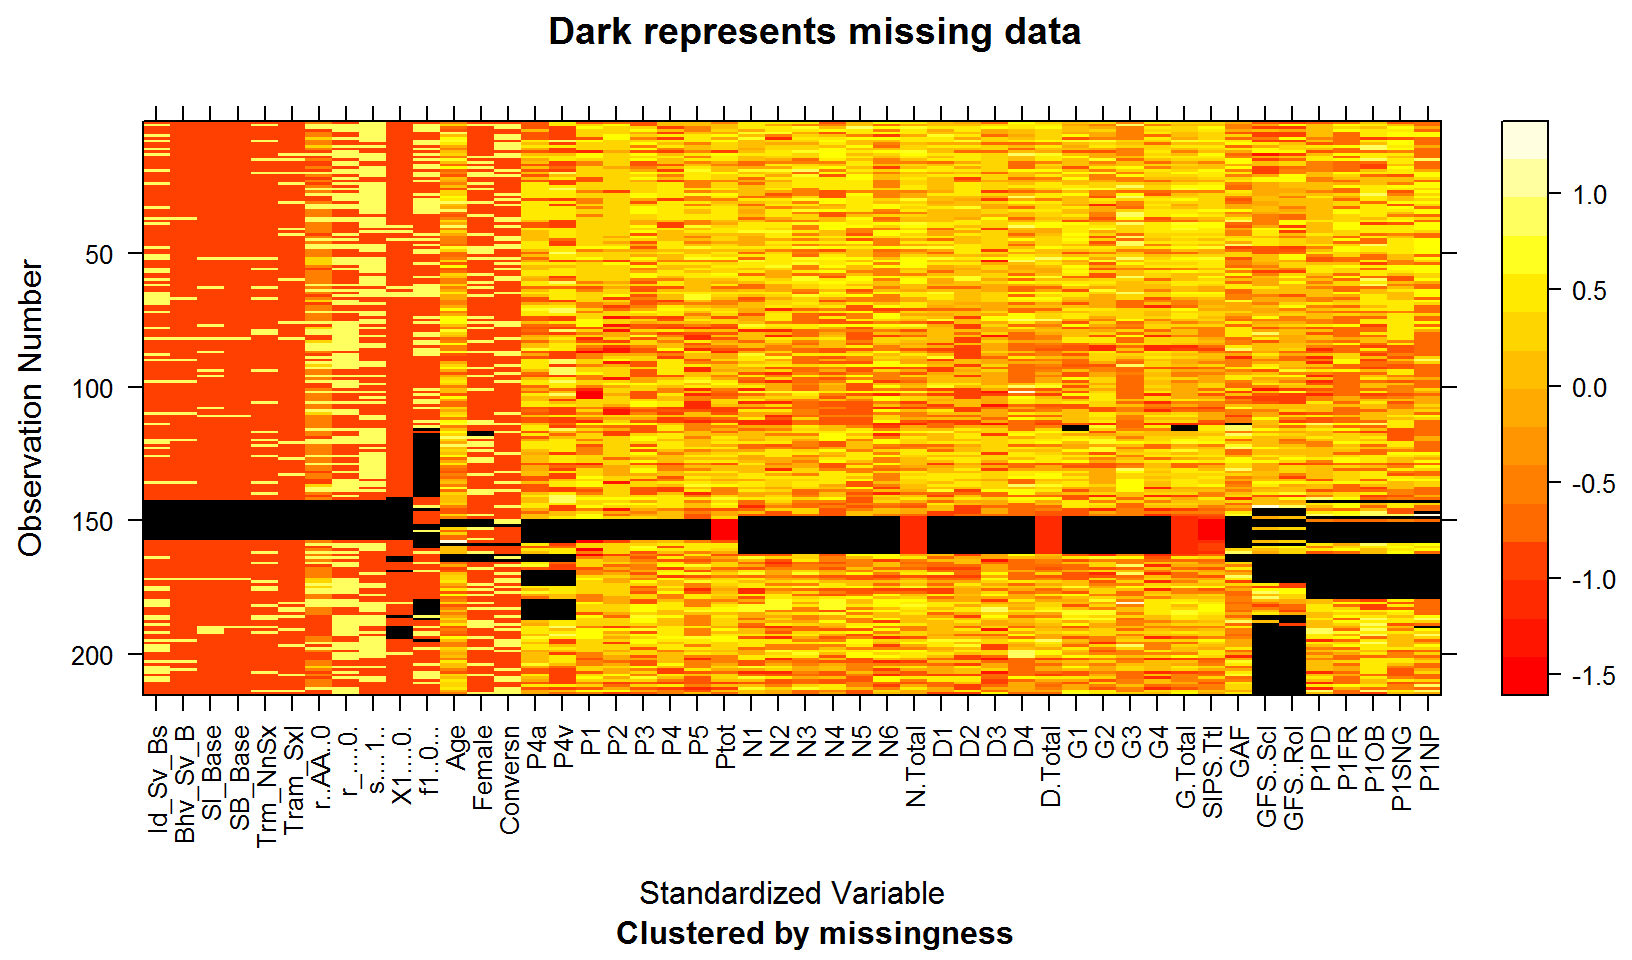
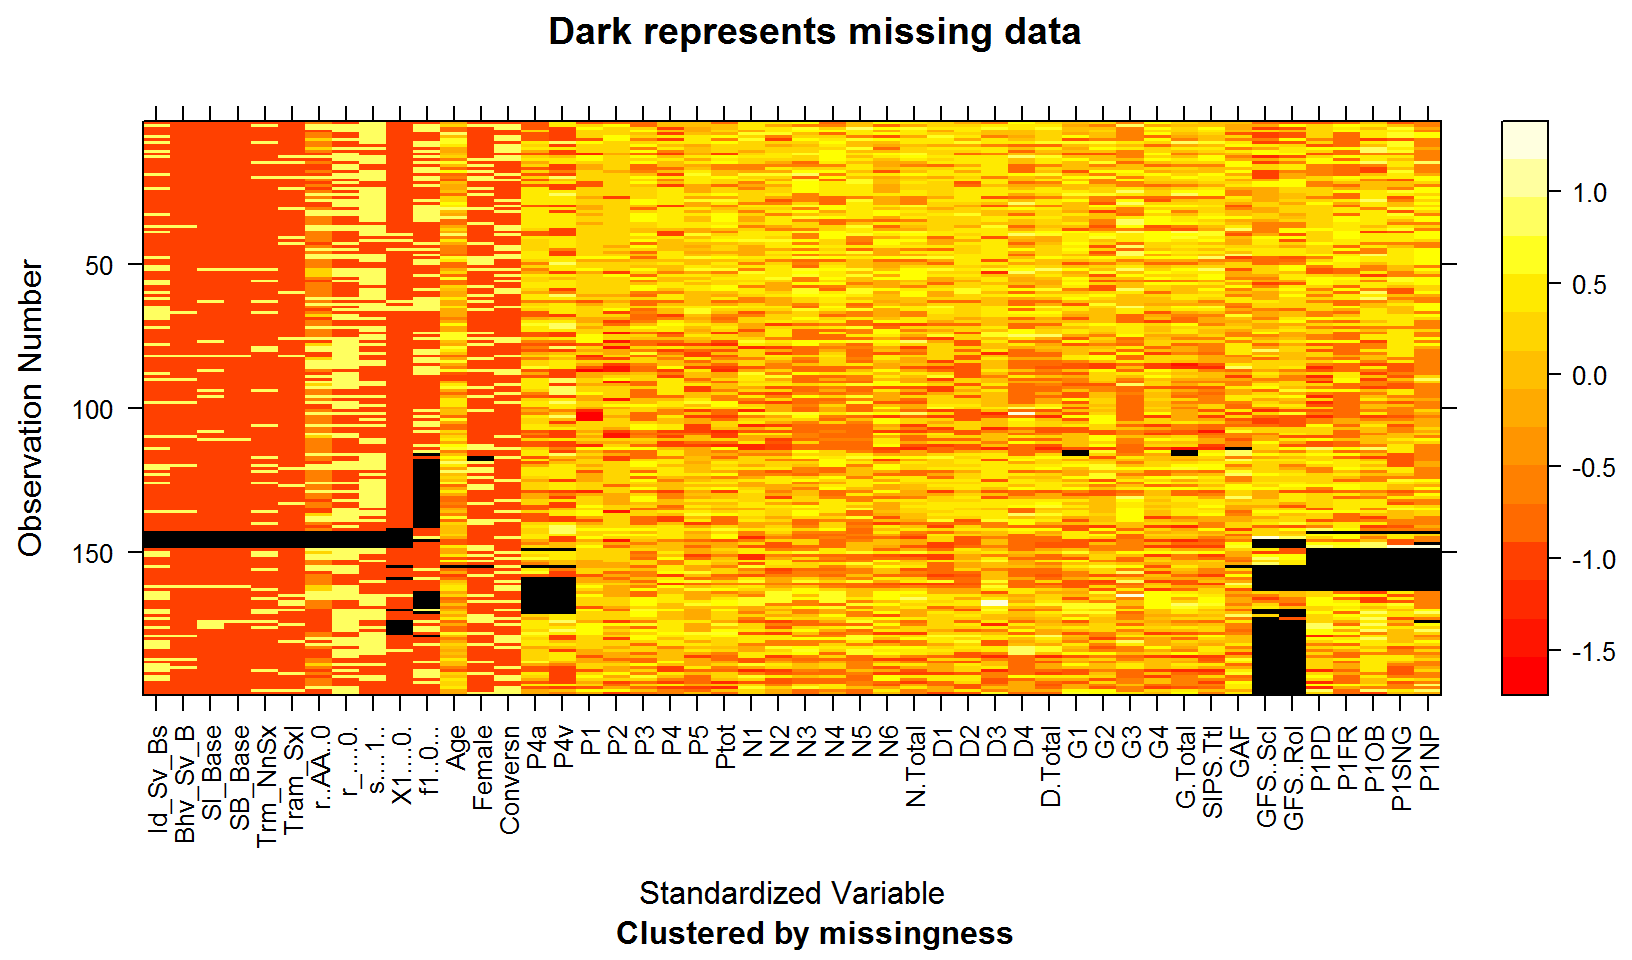
Data Preparation for Modeling
- For constructing the the predictive model we consider all covariates from the descriptive table except:
- we remove the 4 category race variable (leave in the binary one)
- we remove total scores (Ptot, N.Total, D.Total, G.Total and SIPS.Total) since we include the components of each
- We employ K Nearest Neighbors (kNN) Imputaion (k = 5) using the VIM package (kNN function) in R to ``fill in’’ missing data, which handles both continuous and categorical variables. (A. Kowarik, M. Templ (2016) Imputation with R package VIM. Journal of Statistical Software, 74(7), 1-16.)